Global E-Commerce Performance Optimization
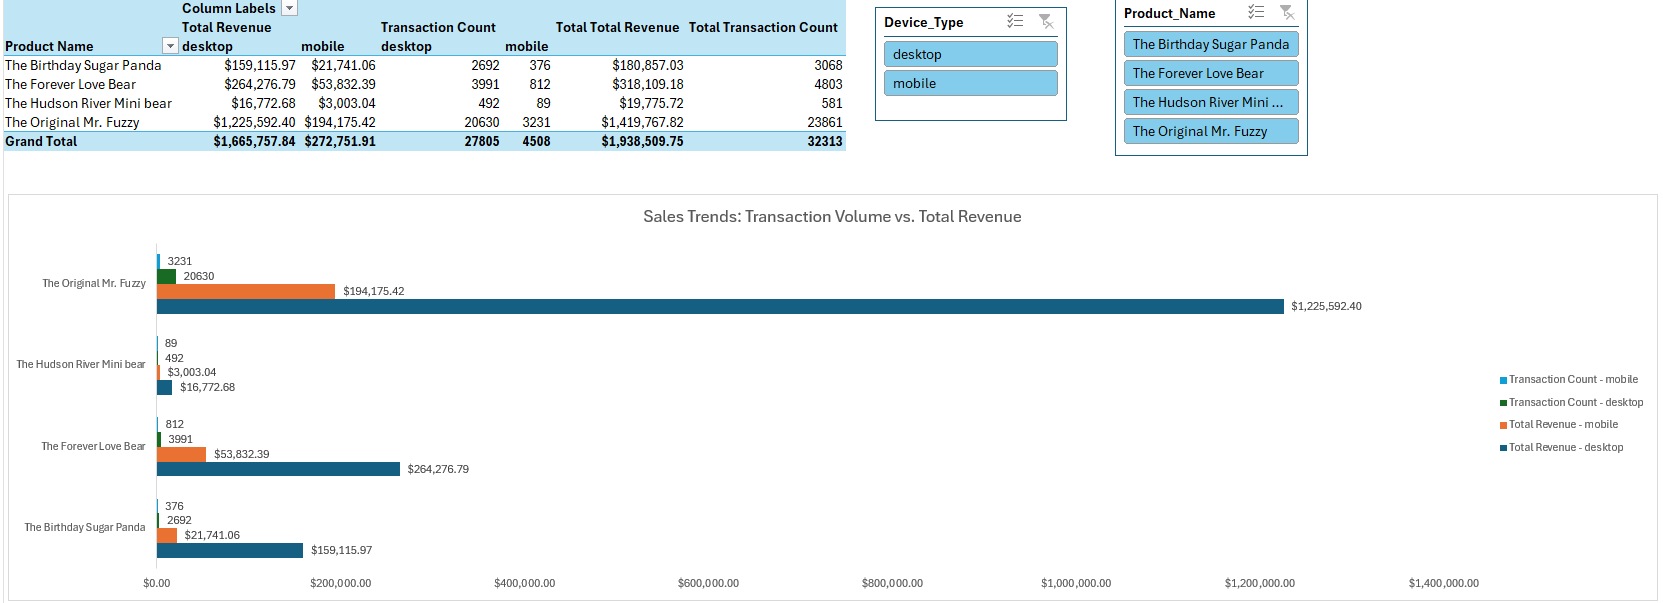
Business Problem: I analyzed 10,000+ rows of Maven Fuzzy Factory sales data to identify which devices and products drive the most revenue. The goal was to help the marketing team decide where to spend their ad budget.
Data Size: Processed 10,000+ rows of raw sales data.
Logic: Created automated marketing segments using Nested IF statements.
Intelligence: Built Calculated Fields to track profit efficiency (Gross Margin) and Average Order Value (AOV).
Automation: Utilized Power Query to clean and connect global omn-channel datasets.
Advanced Excel Functionality:
- VLOOKUP & INDEX-MATCH: Utilized for dynamic data retrieval and connecting the orders dataset with products to pull in pricing and cost information.
- Nested IF Statements: Implemented complex logic to automate customer segmentation (e.g., categorizing users by device and spend level).
- Macros & VBA: Developed automation scripts to handle repetitive data cleaning tasks and to generate intelligence reports instantly.
- Power Query: Used to establish robust data connections and transform raw "Global Omni-Channel Sales" data into a clean, analysis-ready format.
- Pivot Tables & Calculated Fields: Built the core engine of the dashboard, including custom metrics like Gross Margin % and Average Order Value.